Weekly Ecommerce Performance Report Automation: Store Guide
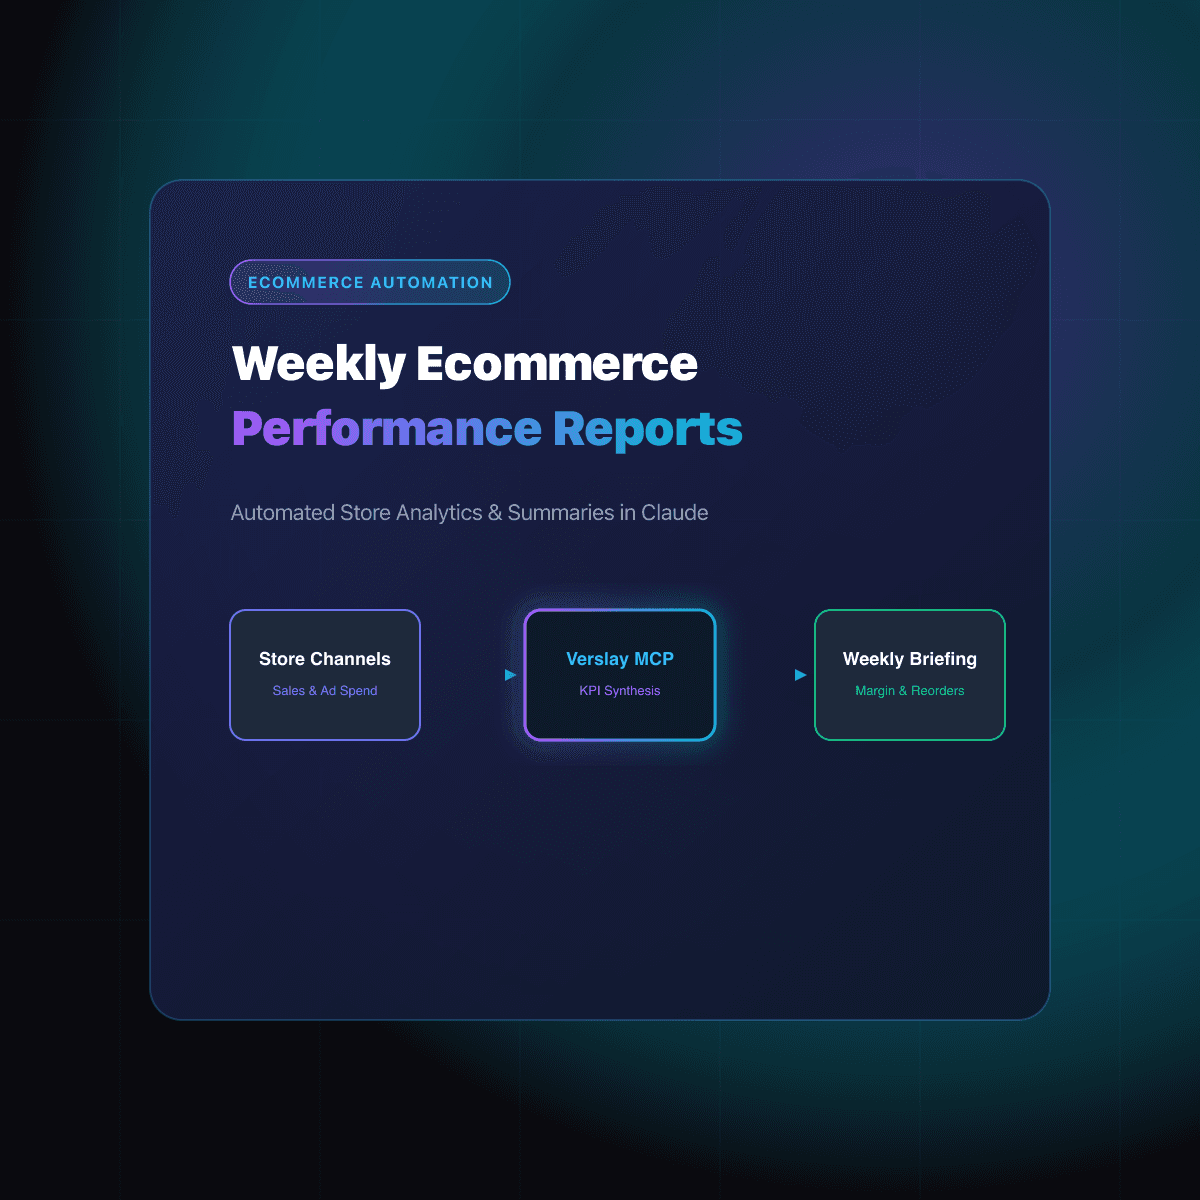
Automating weekly ecommerce performance reports allows online store owners to consolidate revenue figures, ad performance, and inventory health into concise operational briefings using conversational Claude workflows. Instead of spending hours every Monday exporting spreadsheets from Shopify and ad platforms, merchants use the Verslay MCP server to summarize store metrics, identify margin shifts, and highlight low-stock variants in minutes. This structured reporting cadence gives growing ecommerce brands rapid executive visibility while keeping every strategic merchandising decision firmly in human hands.
At a glance
- Core function: Aggregates weekly store sales, ad spend efficiency, customer return rates, and SKU inventory shifts using Claude.
- How it runs: Operates directly inside your Claude workspace connected to your Shopify store and data sources via the Verslay Model Context Protocol (MCP) server.
- Operational benefit: Replaces three to five hours of manual spreadsheet compilation every Monday with an instant, structured performance debrief.
- Target merchant: Growing direct-to-consumer stores and multichannel retailers managing 500 to 50,000 monthly orders.
What is weekly ecommerce performance report automation?
Weekly ecommerce performance report automation is the automated extraction, synthesis, and narrative explanation of core store metrics on a regular seven-day cycle. Rather than logging into disparate administrative dashboards or manually copying numbers into Google Sheets, merchants rely on an AI assistant running in Claude to compile a complete briefing.
A typical online brand relies on several operational tools:
- Storefront platform for gross sales, refunds, fulfillment status, and order volume.
- Advertising channels for campaign expenditures, cost per acquisition, and impression volume.
- Inventory systems for stock thresholds, reorder points, and lead times.
When these data sources remain siloed, store operators see isolated numbers without understanding their combined impact on weekly profitability. An automated report synthesizes these sources into a single narrative, calculating blended performance metrics and pointing out anomalies that warrant immediate attention.
By querying your store data through conversational interfaces, store operators can inspect results and uncover underlying trends:
- Did our blended return on ad spend improve alongside this week's revenue spike?
- Which product collection drove the highest net margin after accounting for returns?
- Which fast-moving items will run out of stock before our scheduled factory shipment arrives?
Merchants can review our AI Agents catalog to see how specialized assistants handle data synthesis, customer communication, and catalog monitoring across ecommerce operations.
Why does manual spreadsheet reporting hold online stores back?
Every Monday, founders and managers pull CSV exports from Shopify, extract ad spend tables, and spend hours formatting spreadsheets for team standups.
Manual reporting creates several operational liabilities as order volume grows:
- Stale Operational Data: By the time an operator cleans and formats spreadsheet formulas on Monday afternoon, the data already reflects past events. Emerging stockouts or sudden drops in ad efficiency over the weekend often go unnoticed until days later.
- Fragmented Attribution: Looking at Shopify sales separately from ad platform dashboards distorts performance. Ad platforms routinely over-report attributed sales due to overlapping attribution windows, concealing margin compression.
- Formula Vulnerability: Manual spreadsheets rely on brittle lookup formulas, fragile macros, and manual data cleaning. A single corrupted cell produces inaccurate profit estimates.
- Executive Fatigue: Spending half of Monday assembling reports leaves managers with little time or mental energy to execute operational improvements, optimize listings, or negotiate supplier terms.
The table below contrasts standard manual spreadsheet compilation with automated Claude performance briefings:
| Performance Reporting Element | Manual Spreadsheet Compilation | Automated Claude Performance Briefing | | :--- | :--- | :--- | | Preparation Time | 3 to 5 hours every Monday morning | Less than 2 minutes via automated prompt | | Data Sources | Disconnected CSV exports copied manually | Direct API queries through Verslay MCP | | Blended Profitability | Requires complex custom formulas | Automatically unifies net sales against ad spend | | Inventory Correlation | Separate check against warehouse records | Immediately flags velocity spikes risking stockouts | | Insight Depth | Static numerical tables without explanation | Context-aware narrative explaining metric shifts | | Follow-up Inquiries | Requires building new spreadsheet pivot tables | Conversational exploration directly in Claude chat |
Transitioning to automated performance debriefs frees founders to focus on strategic merchandising and customer acquisition. You can inspect practical operational setups across our ecommerce use cases.
Which critical ecommerce metrics should your automated weekly report track?
A practical weekly ecommerce report centers strictly on cash flow, unit economics, and operational health across four essential performance pillars.
1. Revenue and Order Economics
The briefing begins with top-line financial health:
- Net Sales: Gross sales minus discounts, returns, and canceled orders.
- Total Orders and Units Sold: Overall transaction volume and basket depth.
- Average Order Value (AOV): Revenue per transaction, tracking whether merchandising bundles or upsell prompts are lifting order size.
- Refund and Return Rate: Percentage of sales lost to returns, tracked via standard Shopify Analytics metrics.
2. Marketing and Acquisition Efficiency
Evaluating marketing performance requires looking beyond isolated ad account dashboards:
- Total Ad Spend: Aggregated investment across paid search, social campaigns, and retargeting channels.
- Blended Return on Ad Spend (Blended ROAS): Total store revenue divided by total ad spend, providing an honest baseline for marketing efficiency.
- Customer Acquisition Cost (CAC): Spend divided by first-time customers, verifying that acquisition costs remain sustainable against initial order values.
- New vs. Returning Customer Split: Tracking whether customer retention or top-of-funnel discovery drives store expansion.
3. Inventory and Catalog Velocity
High sales numbers mean very little if poor inventory management leads to stockouts on bestsellers:
- Top 5 Revenue SKUs: The specific variants generating the largest share of weekly gross margin.
- Velocity Shifts: Items experiencing sudden 30-day run rate accelerations due to influencer mentions or seasonal interest.
- Stockout Projections: Products forecasted to exhaust warehouse supply within fourteen days based on current burn rates.
4. Fulfillment and Customer Service Health
Post-purchase operations directly influence repeat purchase rates and chargeback risks:
- Average Fulfillment Lag: Time elapsed between order placement and warehouse carrier scan.
How do you automate weekly store reporting with Claude and Verslay?
Configuring Claude to produce structured weekly store performance reports takes only a few minutes. Because Verslay provides pre-built MCP connectors, your team does not need custom programming, cloud database hosting, or third-party dashboard licenses.
Step 1: Connect your store channels
Sign in to your Verslay account and authorize your Shopify store alongside your marketing channels. Verslay generates a dedicated Model Context Protocol (MCP) endpoint configured specifically for your workspace credentials.
Step 2: Add the endpoint to your Claude workspace
Link the Verslay MCP server within your Claude account settings. Once connected, Claude gains permission to query your store analytics, order ledgers, and inventory records through standard secure protocol calls whenever you request a report.
Step 3: Run your weekly reporting prompt
Every Monday morning, submit a structured prompt within your Claude conversation. The assistant queries your store data and formats the briefing according to your operational preferences.
Here is a practical operational prompt template store managers use:
Review our Shopify store performance and ad channels for the past seven days (Monday through Sunday) compared to the prior week.

Generate a structured Weekly Ecommerce Performance Briefing with the following sections:

1. Executive Summary:
   - Net sales and percentage change week-over-week.
   - Total order count and Average Order Value (AOV).
   - Net profit margin estimate after discounts and returns.

2. Marketing and Customer Acquisition:
   - Total paid marketing expenditure across channels.
   - Blended Return on Ad Spend (Blended ROAS).
   - First-time buyer volume versus returning customer percentage.

3. Merchandising and Inventory Velocity:
   - Top three revenue-producing SKUs with unit sales.
   - High-velocity items at risk of running out of stock within two weeks.
   - Underperforming catalog items with declining weekly momentum.

4. Operational Flags:
   - Any fulfillment delays exceeding 48 hours.
   - Unusual return rate spikes on specific variant sizes or colors.

5. Top Three Action Items for the Week:
   - Prioritized operational recommendations for our merchandising and growth teams.
Step 4: Review findings and coordinate team priorities
Claude delivers an organized breakdown detailing sales trends, ad return metrics, and inventory alerts. Operators can review the analysis, ask follow-up questions to probe specific SKU anomalies, and forward key action items directly to their growth and warehouse teams.
To see how these connectors integrate with your existing commerce software stack, browse our integrations directory.
How does human oversight keep automated reporting accurate and actionable?
While AI assistants provide remarkable speed in extracting and summarizing large datasets, human merchant judgment remains indispensable. Automated reports should inform strategic decisions rather than execute unilateral changes to marketing budgets, pricing schedules, or supplier purchase orders.
Verslay adheres to clear operational principles to maintain strict operator control:
- Customer-Owned Interface: All queries, prompt executions, and report outputs run inside your team authenticated Claude account.
- Zero Local Infrastructure: Store owners never manage private virtual servers, database migrations, or custom API listeners.
- Merchant Approval Gates: Claude acts as an analytical research partner that flags trends and drafts recommendations. The assistant never alters live store pricing, cancels ad campaigns, or places factory purchase orders without explicit operator sign-off.
- Transparent Reasoning: Every conclusion presented in the briefing links directly to verifiable store records and order timestamps, allowing managers to inspect source figures instantly.
Balancing automated data synthesis with disciplined human review protects store profitability while accelerating operational cadence. To inspect flexible subscription packages designed for scaling DTC brands, visit our pricing page.
Frequently asked questions
What key metrics belong in an automated weekly ecommerce performance report?
A complete weekly briefing summarizes net sales, order volume, average order value, return rates, advertising spend versus blended ROAS, and inventory stockout risks across top SKUs.
How does Claude connect to Shopify to pull weekly performance data?
Claude connects directly to your Shopify store and marketing channels through the Verslay MCP server, querying live order data and analytics without custom scripts.
Can automated reporting calculate blended ROAS across multiple ad platforms?
Yes, the assistant unifies revenue from Shopify with spend figures across your ad accounts to compute true blended return on ad spend and highlight margin trends.
Does automating weekly ecommerce reports require dedicated engineering or servers?
No custom code or server management is required. The entire reporting workflow runs inside your team Claude workspace connected securely via Verslay.
Take the next step with Verslay
Automating weekly ecommerce performance reports gives your team clear visibility into sales trends, marketing return, and inventory risks without manual spreadsheet compilation. Schedule a consultation at https://calendly.com/verslay/30mins to see how our AI agents support your store operations.